Analysis & Measurement Tab
Import DBC
Import DBC... loads a .dbc file and decodes every subsequent frame
whose CAN ID matches a message defined in it, via
dbcppp. Decoded signals appear as
child rows under their frame in the Trace view (expand the arrow next to a
row), and become available to plot in the Graph view.
The repository ships test/sample.dbc
for trying this against the synthetic test source with zero hardware - see
Getting Started.
The loaded DBC's path is saved in Runes, and re-imported automatically when that rune is loaded.
Trace vs Graph view
This tab switches the whole content area between two views:
- Trace - the frame table (also what's showing by default on every other tab). Click the arrow next to a row to unfold it into decoded signals, name/physical-value/unit, straight from the imported DBC.
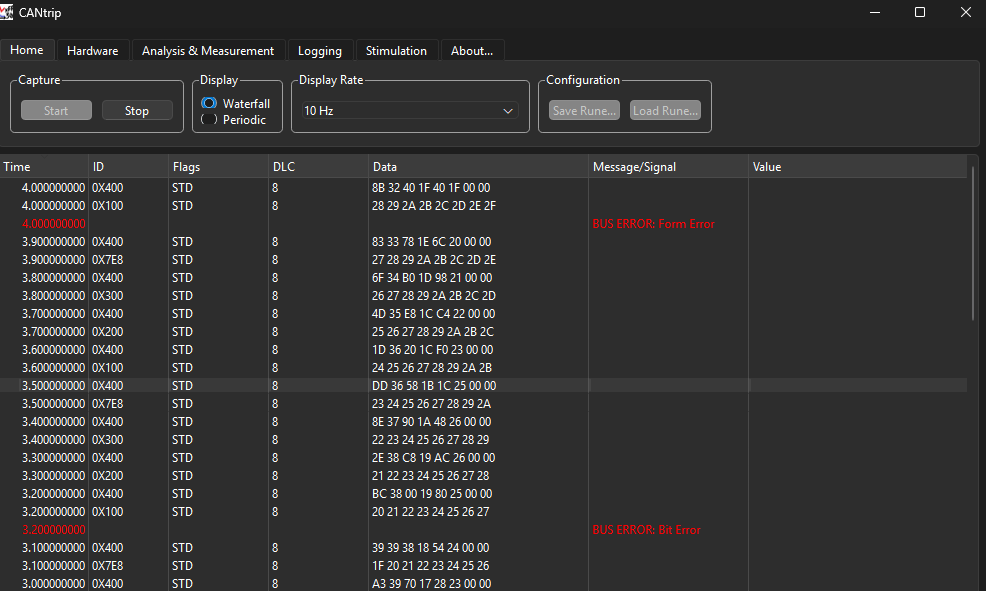
Column order and widths are drag-to-rearrange/resize, and persist through Runes.
- Graph - see below.
Graph view
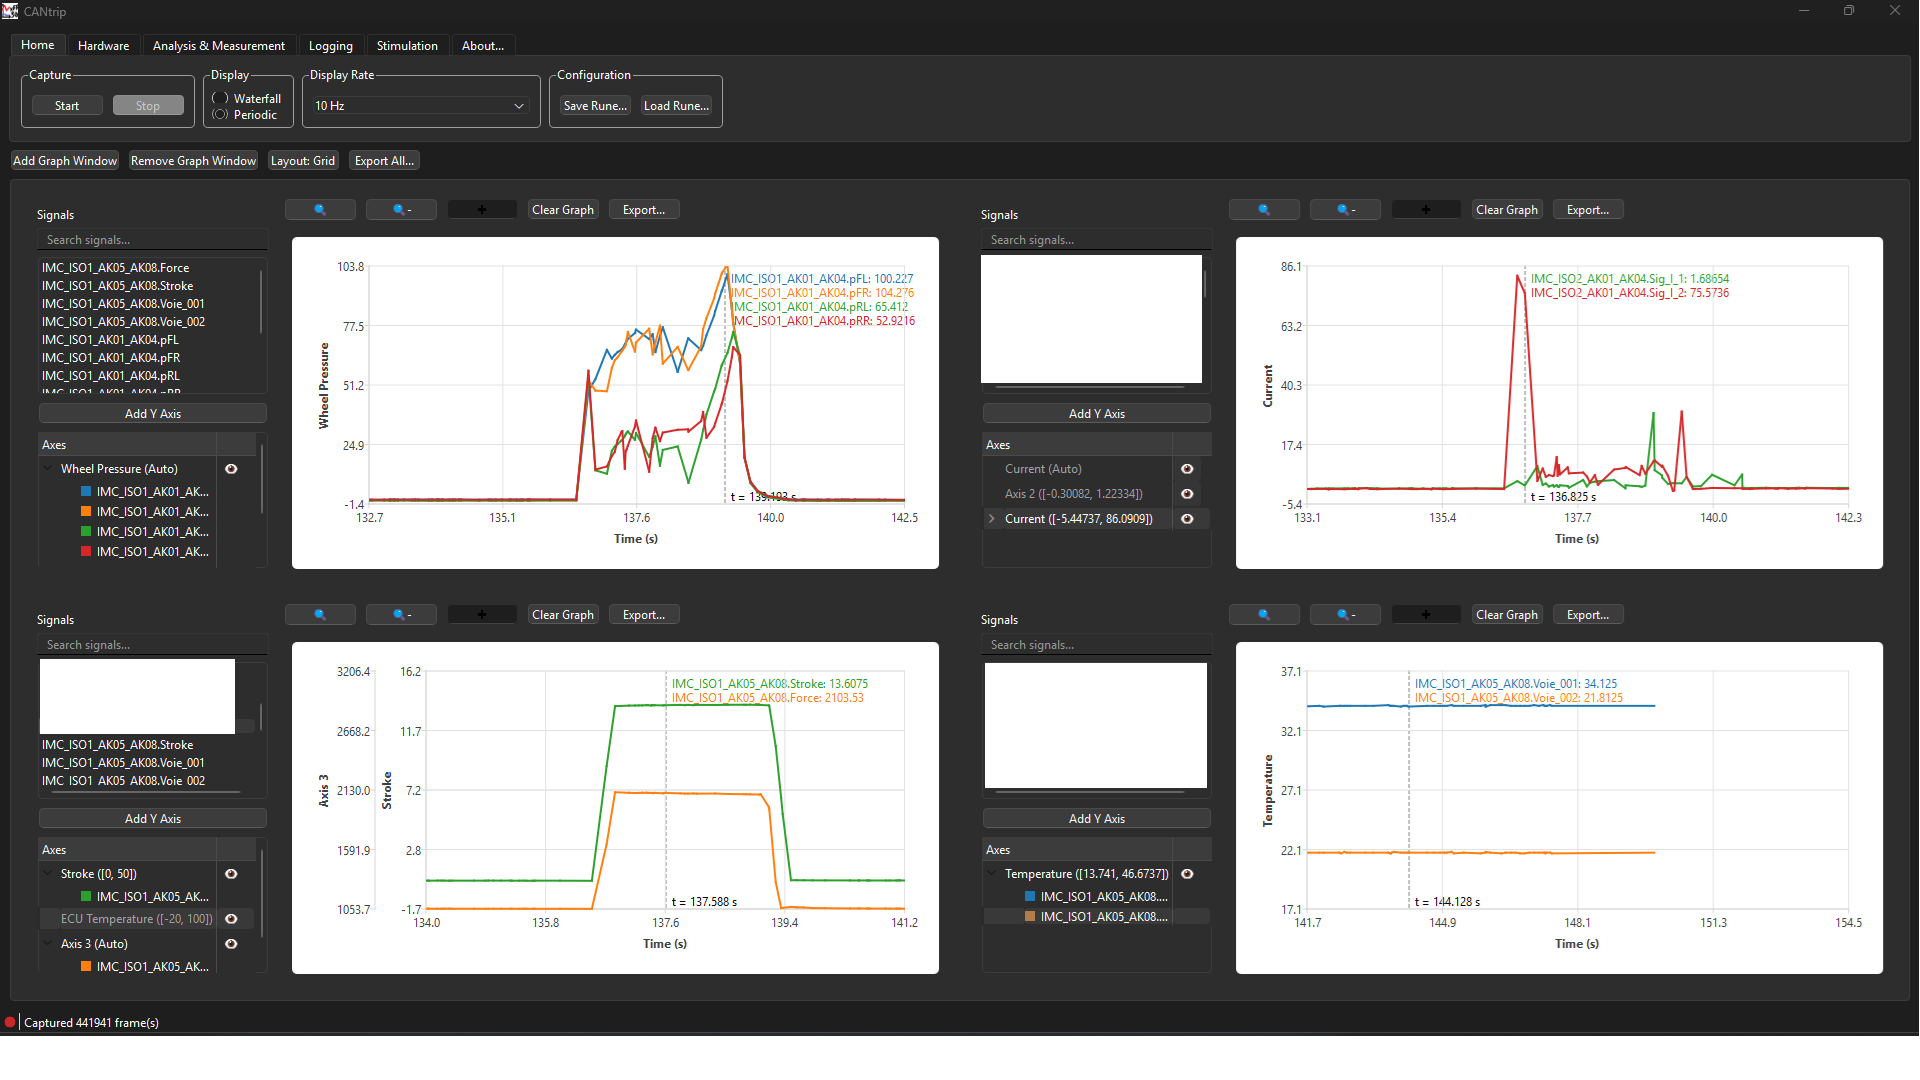
A signal-plotting view, all sharing one time X axis:
- Signal list (left side) - every signal from every imported DBC message, searchable. Drag one onto an axis to plot it, or multi-select and drag several at once onto the same axis.
- Y axes - add as many as you want, each can host multiple signals. Auto-scale or set fixed bounds per axis; each plotted signal gets its own color and line style (solid/dashed/dotted/scatter). An eye-toggle per axis hides/shows it without removing its configuration.
- Zoom - rectangle-select an area to zoom into it, scroll-wheel zoom per-axis, and a reset button to snap back out.
- Cursors - hover for a live readout of every plotted signal's value at that point in time; click-drag between two points for a delta measurement (time and value difference).
- Clear Graph - resets plotted data back to t=0 without discarding your axis/signal layout, so Start → Stop → Start doesn't make you rebuild the whole view from scratch.
Multiple windows
Up to 6 independent graph windows at once, arranged Stacked (each full width, scrollable) or Grid. Each window's full axis/signal layout is saved in Runes.
Export
Export the current window as PNG, SVG, or PDF, or Export All to export every open graph window in one pass.