Hardware Tab
Network Hardware
The dropdown lists every CAN channel CANtrip could find, across every vendor SDK actually installed on the machine, plus the always-available synthetic test source (see Getting Started). Refresh re-scans if you plugged in hardware after launching CANtrip.
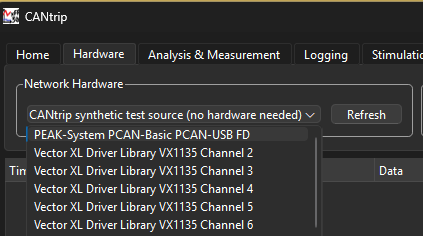
CANtrip isn't tied to one CAN adapter vendor - see Architecture: The AVlabs CAN Backend for how that actually works.
CAN Controller
Click CAN Controller... to configure bus timing. Three modes:
- CAN (classic) - just a bitrate preset (125k/250k/500k/1M).
- ISO CAN FD - real BRP/TSEG1/TSEG2/SJW register values computed live from a target nominal/data bitrate and a target sample point, using the same algorithm python-can's bit-timing calculator uses.
- Expert CAN FD - type those raw register values in directly, for a bus whose timing someone already specified in exact register terms.
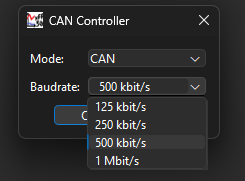
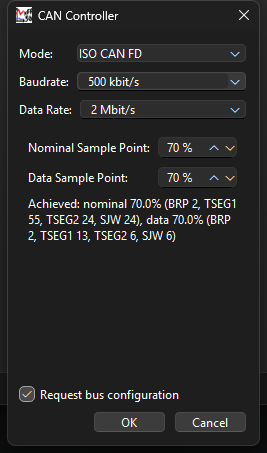
Bus timing set here only takes effect the next time a capture starts, not live against an already-running capture.
Request bus configuration
The checkbox at the bottom of the dialog, checked by default, controls whether CANtrip asks for exclusive configuration rights on the channel:
- Checked (default): today's normal behavior. CANtrip configures the bus (bitrate/timing) itself when the capture starts.
- Unchecked (listen-only): CANtrip joins the channel without requesting configuration rights, assuming another application (a diagnostics tool, another instance of CANtrip on a different machine, etc.) has already configured it. This is the same idea as real CANalyzer's "Init Access" checkbox, for the same reason: letting more than one tool observe a live bus at once without them fighting over who configures it.
Vector and PEAK hardware support this very differently under the hood - see Architecture: Send Message Internals for why unchecking this matters more on PEAK than it might seem.
This setting is saved in Runes.
Autodetect Bus Config
Don't know your bus's actual bitrate? Autodetect scans the selected hardware against the common classic-CAN presets and applies whichever one comes back clean.
This only works for classic CAN bitrates today, not CAN FD timing.
Bus Load & Statistics
Bus Load... swaps the main content area to a dedicated view, modeled on PEAK PCAN-View's own Bus Load window - the same "changes the main window" behavior Stimulation uses, just reached from a button here instead of a ribbon tab.
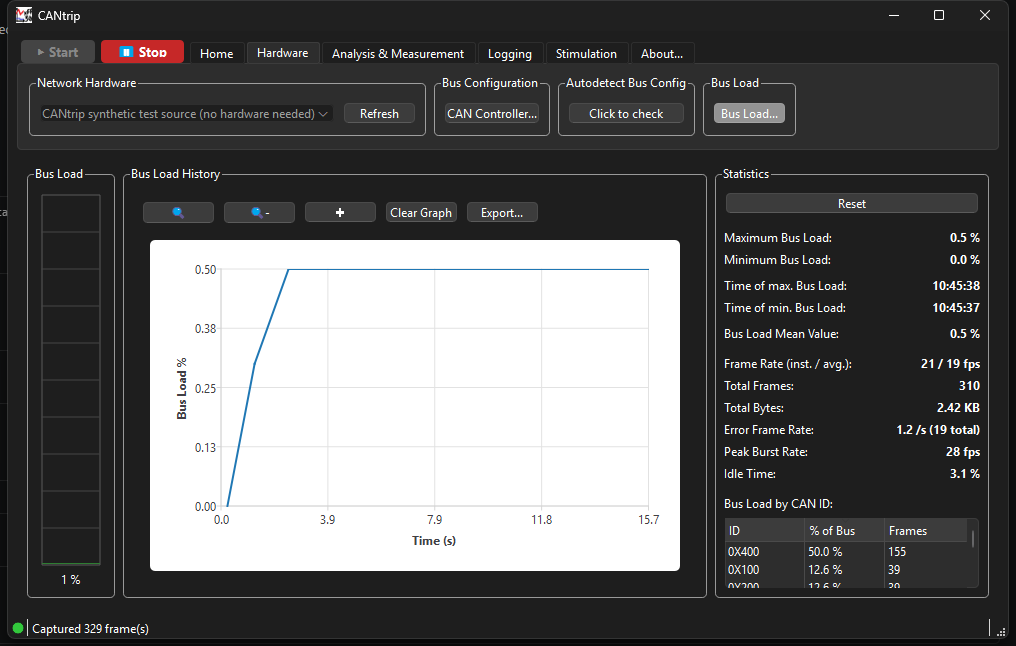
Three panels:
- Left - Bus Load: a vertical gauge showing the instant bus load percentage right now, color-shifting toward red as it approaches 100%.
- Middle - Bus Load History: the load percentage plotted over time. This is a real Graph view under the hood (zoom, cursor tool, and Export all work exactly the same way), just locked to this one series with its own signal-picker UI hidden.
- Right - Statistics: maximum and minimum bus load and exactly when each occurred, the mean bus load, frame rate (instant and session average), total frames and bytes captured, error-frame rate, peak burst rate (the busiest single moment seen), idle time percentage, and a sortable Bus Load by CAN ID table showing which specific IDs are actually consuming the bus. Reset clears the graph and every statistic together, in one action.
The percentage itself accounts for real per-frame bit overhead (arbitration, control, CRC, ACK, EOF, plus an estimated bit-stuffing factor) at the channel's actual configured bitrate - not a naive byte-count-over-time approximation - with correct dual-rate handling for CAN FD (nominal bitrate during arbitration, data bitrate from the bit-rate-switch point onward). See Architecture: Bus Load Calculation for the actual formula and why it's a documented approximation rather than exact bit-level simulation.
Unlike the Stimulation received pane, statistics here keep accumulating in the background regardless of which tab is currently showing - max/min/ mean are meant to reflect the whole capture session, not just however long you've had this view open.